High Dynamic Range (HDR) Technology Explained
IntroductionSince the introduction of our HDR-Product line in 2013, we’ve had many questions on how we’ve been able to increase the performance of our GPR-systems to this exceptionally high level. Explaining to our end users why our new product line is achieving this high level of data quality may not be too difficult. Explaining why we don’t just get excellent data but also are able to expand the dynamic range beyond the specification of available electronic devices, necessitate a somewhat deeper description. This document aims at explaining in a simplified way why the new technology, which forms the base of our HDR-series, is superior and just how it works.
Noise in GPR-systemsAn end user can find it difficult to get a true picture of the noise level in GPR-systems. It has become widespread practice among GPR-manufacturers to hide raw data or to apply filters prior to saving data or simply not to provide any tools for looking at it. MALA is an outlier in this respect; we have (to the grief of part of our organization) always provided raw data, as well as tools for analysing it. Before we take a closer look at typical noise, it’s important to have an understanding of precisely what we’re looking for. Noise is not the same thing as scattering or ring-down (in general) as some people believe, noise is signals, created internally or externally which cannot be traced to wanted transmitter output being reflected from any target. Usually we also differ between coherent and random noise, the first being directly connected to the internal system operations and therefore able to show up as pattern or horizons, the latter showing a random appearance. So we can talk about two families of noise sources:
GPR’s are Ultra Wide Band (UWB) instruments and this makes the noise fighting more difficult. In narrow-band systems, such as GPS, engineers have an arsenal of filters they can throw on the front end in order to eliminate noise, for us this is a closed path. In fact the bandwidth of a system is directly linked to the noise figure of that system; the higher the frequency (and the wider the bandwidth) the higher the noise, which should be in line with most users experiences. It is common practice to express the noise figure as signal-to-noise ratio (SNR), which is simply the power of the signal over the power of the noise, expressed in decibels:
SNR = 10Log10(Psignal/Pnoise) = 20Log10(Asignal/Anoise)
Where P is power and A is amplitude
If we use the largest possible signal in the system in the above formula and assume that the noise amplitude is the smallest signal the system can resolve, we get the dynamic range (DNR) out of the formula. DNR can also be expressed in number of bits, where each additional bit is worth 6dB. In figure 1, we show true raw data vs filtered data from a traditional interleaved GPR system. Most manufacturers perform filtering on the fly and then only save the resulting data. Now, precisely what does these levels seen in figure 1 tells us? Before we go deeper into that, we will take a look on how noise may be fought and how system performance can be increased.
Noise reduction, averaging/stackingFor decades GPR manufactures have been working on reducing the internal noise in their systems, thus increasing the signal-to-noise ratio. This has been done by (1), refining the front end electronics and (2), increasing the number of averaging (stacks) the system is able to do. In time-interleaved systems, we collect one sample on the receiver end each time the transmitter fires. So the data collection rate equals the repetition rate (reprate) of the transmitter. It follows that the higher the reprate, the higher the number of averaging could be done in the system during the same time. Modern time-interleaved systems are fast but whenever we use the system in continuous mode, as opposed to point-by-point mode, the level of averaging (stacks) is limited.
It’s well known that if we have,
By averaging, we reduce the noise (increase the SNR) by the square root of the number of averaging done. This is the driving force behind the development of faster and faster GPR systems. We have moved from 20-40KHz to 100’s of kilohertz over the last 25 years. Today, regulations put a rather harsh limit on the possibility of further increasing performance by raising the reprate. Averaging, over-sampling and dithering are connected concepts in noise reduction techniques. We may choose to over-sample a signal, followed by decimation and thereby gaining higher resolution and DNR. One needs 4 times over-sampling for each bit, in increased SNR. In the same way we may use averaging with the same penalty, 4 stacks will ideally yield one extra bit. All this works provided there’s some “good” noise present (as described earlier), if not, noise has to be added which is then called dithering. If you want to extend the performance of the system to levels that require higher resolution than provided by the present ADC-converter, the dithering noise must have sufficient amplitude and all operations must be done with higher number of bits. The theory for how this works and in which case one method is better than the other, incorporates complexity well beyond the scope of this document, it can easily be found on the Internet though. A GPR user may be somewhat surprised when we tell some truth about modern receiver electronics. A quick scan on 16-bits ADC’s suitable for GPR use, shows that the effective number of bits out of these devices are usually below 14. Add to this, noise from supporting electronics such as sample&hold amplifiers and power supplies, we can then conclude that in order to reach truly 16-bits, you have to allow for high levels of averaging. For example, an ADC with 13-effective bits would require 4x4x4 = 64 stacks to reach true 16-bit resolution (in theory). In reality the number of required stacks is usually higher since the supporting electronics adds noise and since dithering noise is usually not entirely ideal (not completely random and uncorrelated to the sampling process). More about number of bits, SNR and DNRAll conventional time-interleaved systems on the market today, claims 16-bit data resolution and some manufacturers mix the data output with the data resolution, claiming 32-bit! What does this mean?
The system used when collecting the data shown in figure 1, was not able to produce a fully useful 16-bit resolution, even though some averaging was done. And let’s be clear, conventional time-interleaved instrumentation which we all still use are, in general, not able to present 96dB dynamic range, this number is a theoretical construction referring to misunderstood specifications of the components inside the GPR, not something which a user can utilize. It’s true that we've seen data very close to 96dB in lab environments or in boreholes but in practical situations this is not the case.
It goes without saying that manufacturers claiming 32-bit resolution and/or 192dB dynamic range, either don’t know what they’re talking about or want to confuse potential clients.There’s no GPR system which can truthfully claim this performance, even if one squeezes down the bandwidth to a few Hz (rendering the system useless), such numbers are unheard of in the real world of GPR.
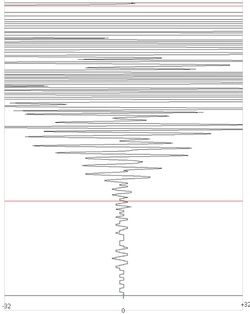
So, how would data from a true 16-bit system look? In figure 2, we present a trace (A-scan) without any filters applied, where it can be clearly seen how the ADC discriminates the analogue input into clear discrete levels at the end of the trace.
The answer lies in that we used 16-bit representation of the data and that the data actually contains significantly more information. In the radargram though, we see the effect of our “good” noise, which acts in a way that shifts the bits in relation to the underlying physical information, as opposed to random. As time passes and bits come in, they are shifted to ones or zeroes by the dithering noise, this reveals the hidden structures in the image while the individual traces appears to contain just two random bit levels.
If we now visualize this data with 32-bit representation and compare the same data line (see figure 4), we can clearly see how instead of just level shifts between -1 and 0, we have normally looking radar data. This shows that the system was able to gather data at higher dynamic range than what we can visualize with 16-bits. It is rather straightforward to find out just how well a system preforms, in a certain case. You just need to measure the maximum amplitude along a trace and compare it with the lowest amplitude (or the noise level) and put the numbers into formula (1). In this particular dataset we measured a dynamic range of 109dB or slightly more than 18 bits. ConclusionsMALA’s HDR systems represents a new generation of GPR-instrumentation. Sensitivity and dynamic range is superior when compared with conventional time-interleaved systems. The technique’s to improve the performance is rather old and have been used for a long time in audio-products; they rest on sound physical base. However, it has not been practical to apply these methods to GPR-data until recently due to lack of sufficiently fast digitizing devices.
The HDR design antennas are based on real-time sampling techniques. Besides this leap in technology, the other parts of the instruments have also been improved, together yielding GPR-instruments with far better performance. It is likely that the whole GPR-industry will follows MALA’s lead and invest in this new technology in the near future. Credit to Bernt Johansson from MALÅ for compiling this comprehensive overview of the HDR technology.
|
REQUEST MORE INFO
The HDR technology is available in the following MALA systems:
MALA EasyLocator HDR MALA GroundExplorer RENT AN HDR GPR unit
HDR units are available for rental Australia wide. Free training introduction with your first rental. |


